The oscilloscope is basically a graph-displaying device - it draws a graph of an electrical signal. In most applications the graph shows how signals change over time: the vertical (Y) axis represents voltage and the horizontal (X) axis represents time. The intensity or brightness of the display is sometimes called the Z axis. (See Figure 1.) This simple graph can tell you many things about a signal. Here are a few:
Ø You can determine the time and voltage values of a signal.
Ø You can calculate the frequency of an oscillating signal.
Ø You can see the "moving parts" of a circuit represented by the signal.
Ø You can tell if a malfunctioning component is distorting the signal.
Ø You can find out how much of a signal is direct current (DC) or alternating current (AC).
Ø You can tell how much of the signal is noise and whether the noise is changing with time.
Oscilloscopes also come in analog and digital types. An analog oscilloscope works by directly applying a voltage being measured to an electron beam moving across the oscilloscope screen. The voltage deflects the beam up and down proportionally, tracing the waveform on the screen. This gives an immediate picture of the waveform. In contrast, a digital oscilloscope samples the waveform and uses an analog-to-digital converter (or ADC) to convert the voltage being measured into digital information. It then uses this digital information to reconstruct the waveform on the screen. Analog oscilloscopes work somewhat differently than digital oscilloscopes. However, several of the internal systems are similar. Analog oscilloscopes are somewhat simpler in concept and are described first, followed by a description of digital oscilloscopes.
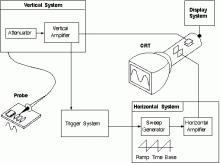
Analog Oscilloscopes : When you connect an oscilloscope probe to a circuit, the voltage signal travels through the probe to the vertical system of the oscilloscope. Figure is a simple block diagram that shows how an analog oscilloscope displays a measured signal.
Depending on how you set the vertical scale (volts/div control), an attenuator reduces the signal voltage or an amplifier increases the signal voltage.
Next, the signal travels directly to the vertical deflection plates of the cathode ray tube (CRT). Voltage applied to these deflection plates causes a glowing dot to move. (An electron beam hitting phosphor inside the CRT creates the glowing dot.) A positive voltage causes the dot to move up while a negative voltage causes the dot to move down.
The signal also travels to the trigger system to start or trigger a "horizontal sweep." Horizontal sweep is a term referring to the action of the horizontal system causing the glowing dot to move across the screen. Triggering the horizontal system causes the horizontal time base to move the glowing dot across the screen from left to right within a specific time interval. Many sweeps in rapid sequence cause the movement of the glowing dot to blend into a solid line. At higher speeds, the dot may sweep across the screen up to 500,000 times each second.
Together, the horizontal sweeping action and the vertical deflection action traces a graph of the signal on the screen. The trigger is necessary to stabilize a repeating signal. It ensures that the sweep begins at the same point of a repeating signal, resulting in a clear picture as shown in Figure.
In conclusion, to use an analog oscilloscope, you need to adjust three basic settings to accommodate an incoming signal:
The attenuation or amplification of the signal. Use the volts/div control to adjust the amplitude of the signal before it is applied to the vertical deflection plates.
The time base. Use the sec/div control to set the amount of time per division represented horizontally across the screen.
The triggering of the oscilloscope. Use the trigger level to stabilize a repeating signal, as well as triggering on a single event.


